At the end of this article, I will declare my willingness to do something that would get me arrested if Donald Trump can get Mexico to pay for his wall. I’m 100% certain that if he’s able to win the nomination (doubtful) and then the general election (nearly impossible) that he will never be able...Read More
Former Presidential candidate Marco Rubio spoke with Mark Levin and made an interesting statement. He didn’t come out and endorse Ted Cruz, but he did say that he’s the right conservative to be the nominee.Read More
Last week, Donald Trump made headlines (as he’s wont to do) by visiting the 9/11 Memorial in New York City. His supporters are trumpeting it as a wonderful visit to the recent historical centerpiece of the tragedy that rocked the world. They’re also very quick to point out that he donated $100,000 in his quick...Read More
If there’s one demographic that should favor Ted Cruz in New York, it’s the Jewish vote. With one opponent who has a family history of anti-Semitic views and another opponent that is irrelevant, it behooves Cruz to work with the pro-Israel voters in the state to act as a firewall against Donald Trump getting a...Read More
Campaigning to become a party’s nominee for President of the United States is very difficult. It requires attention to detail, knowledge of the rules, understanding of the terrain, properly planned infrastructure, and the ability to make good decisions. Once nominated, the race to accumulate states through the electoral college and operate within the confines of...Read More
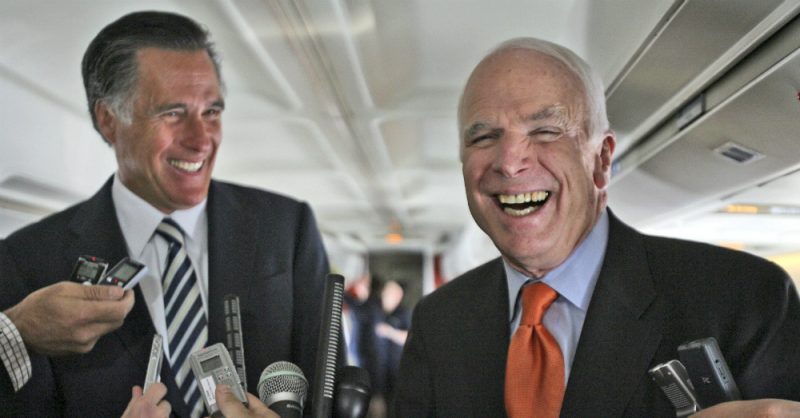
In 2012, the Establishment had an agenda. They didn’t want Ron Paul and his “crazies” mucking up the Republican convention by trying to draw attention to themselves. They wanted to demonstrate unity by having all of the attention paid to the nominee, Mitt Romney. As a result, RNC Rule 40B was established. Now, the tables...Read More
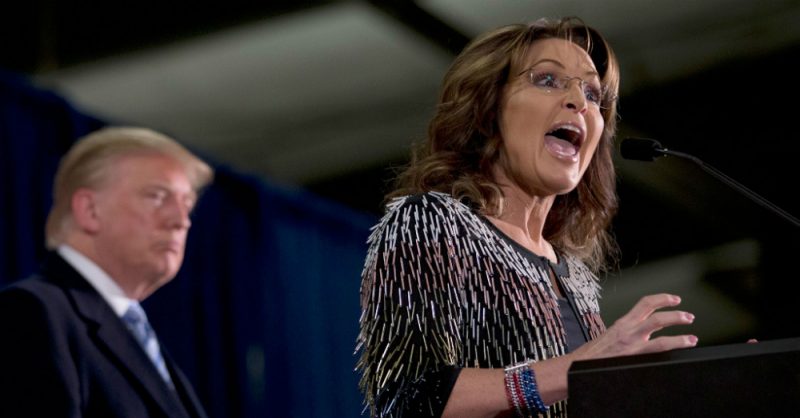
The key to any Presidential general election is staying close in the unfriendly demographics while winning big in the friendly demographics. Donald Trump is doing the exact opposite. He’s trailing in what should be one of his friendliest demographics: white female voters.Read More
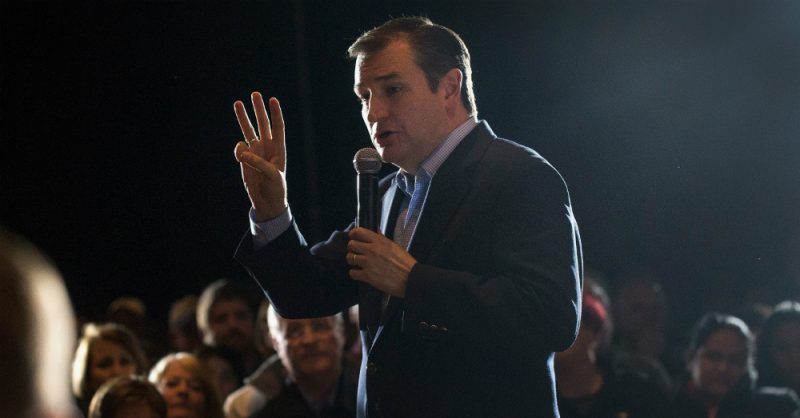
One of the biggest knocks against Donald Trump has been that the country cannot afford someone who requires on-the-job-training. It isn’t just the monumental task of learning what it takes to be President. It’s also the events that lead up to the election, including the nominating process. For this, Ted Cruz has demonstrated a profoundly...Read More
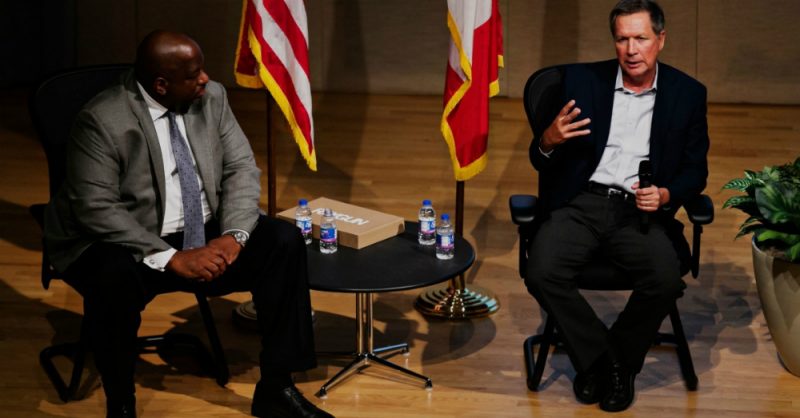
For months, John Kasich has taken every opportunity in his scarce debate moments, infrequent interviews, and low-volume stump speeches to point out how little attention he was getting from the media. As one of the three finalists for the GOP nomination, he’s going to get more attention than ever before. That attention is going to...Read More
With all of the attention being given to Donald Trump as the likely GOP nominee, there’s a problem that nobody seems to be discussing. Even if Trump wins Ohio and Florida, his path to the nomination is greatly hampered if Marco Rubio and John Kasich drop out. In fact, winning their states and knocking them...Read More