Infographics are powerful visual communication tools that combine text, data, images, and other graphic elements to quickly convey complex information. The right infographic style helps organize information and make it more understandable and engaging.
There are several common infographic types, each optimized for visualizing particular data or serving specific communication goals:
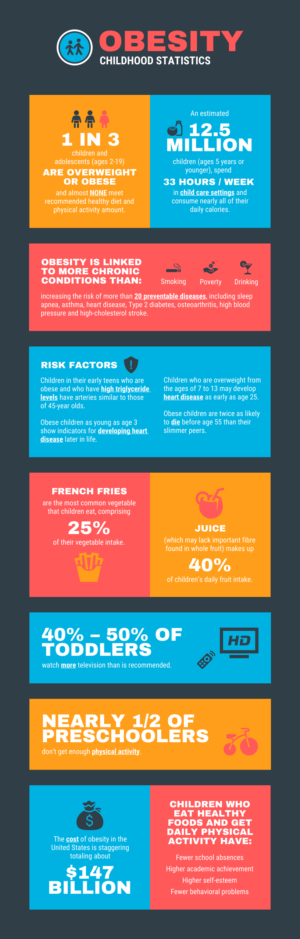
Statistical infographics employ charts, graphs, icons, and numbers to present statistics, trends, patterns, and other quantitative data in a visually captivating way.
For example, an infographic on childhood obesity can share shocking statistics that help educate and motivate parents and caregivers. Statistical infographics can also use charts, graphs, and other forms of visual data to present information.
Informational infographics focus on organizing, explaining, and illustrating facts and details on a topic through text, bullet points, icons, labels, and visual elements like photos.
Headings, subheadings, and concise blocks of text paired with engaging graphics walk readers through the information methodically. Informational infographics educate audiences, raise awareness, and share “how-to” advice. For example, an informational infographic can provide steps to achieve an outcome, like “5 Tips to Keep Your Chin Up.

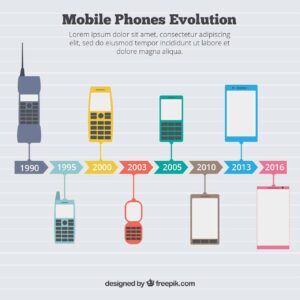
Timeline infographics chronologically arrange major events, milestones, or developments along a line or timeline graphic. Dates, descriptive labels, photos, and icons pinpoint important moments.
Timelines trace historical sequences, plan projects, illustrate biographies, and report progress. The visual timeline format makes chronological relationships and passing the time easy to grasp. For example, the following infographic showcases the evolution of the mobile phone in a quick and fun way.
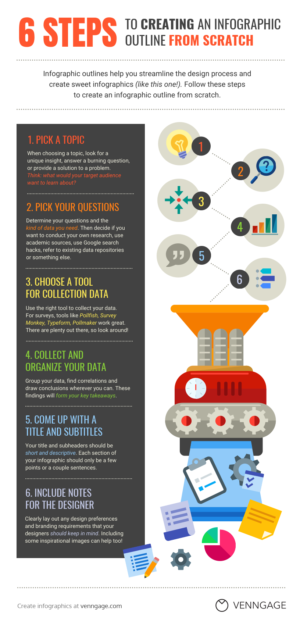
Process infographics visually map procedures involving multiple steps, stages, or components. Numbers, arrows, icons, and graphics illustrate the workflow from start to finish.
Walking through each phase in sequence makes process infographics ideal for explaining how something works, offering how-to instructions, or detailing steps to achieve a goal.
Using a process infographic, you can teach others how to create an infographic from start to finish.
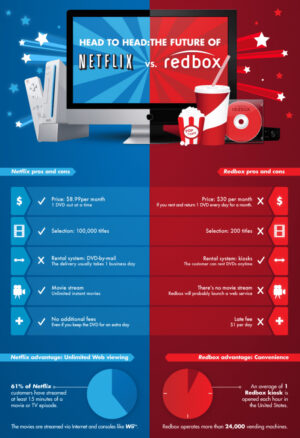
Comparison infographics place two or more subjects side-by-side to highlight differences. Rather than a single chart, they use a mix of visuals like charts, tables, icons, and images to creatively contrast information.
These are ideal for buyer’s guides, product reviews, and competitive analyses. The side-by-side format lets you showcase extensive details so audiences can assess differences and determine which option fits their needs.
For example, a comparison infographic could contrast two services, like the movie rental giants Netflix and Redbox.
When deciding which infographic style to use, consider the story you want to tell and your audience. Statistical data lends itself to charts and figures. Timelines organize chronological data. Processes come to life through flow diagrams. Informational content benefits from concise text, icons, and visual organization.
The most effective infographics tailor the visual format to the narrative, enhancing understanding and memorability. Experiment with different infographic types until you find the best fit for translating data into engaging visual stories.